はじめに
皆さん最近Zabbixやってますか?
僕は放置気味です。
さて、Centreon 2.4以降ではCustom Viewと言う機能が追加され、ログイン後のデフォルト画面はそれを表示するようになりました。
でも、何もしないと編集ボタンだけが表示されて寂しい感じになってしまうので、CentreonのページからWidgetをダウンロードしてきて、それを設定してみようと思います。
見るべきページは以下の3点です。
Ubuntu 10.04を使っているので、それに合わせて書きます。
centreon.comから拾ってくる方法と、Centreon forgeから拾ってくる方法があるようですが、ここでは前者で書きます。
 1
 2
 3
 4
 5
 6
 7
 8
 9
10
11
12
13
14
15
|
# wget --trust-server-names http://download.centreon.com/index.php?id=4270
# wget --trust-server-names http://download.centreon.com/index.php?id=4278
# wget --trust-server-names http://download.centreon.com/index.php?id=4280
# wget --trust-server-names http://download.centreon.com/index.php?id=4279

# tar -zxf centreon-widget-host-monitoring-1.1.2.tar.gz
# tar -zxf centreon-widget-hostgroup-monitoring-1.1.1.tar.gz
# tar -zxf centreon-widget-service-monitoring-1.1.2.tar.gz
# tar -zxf centreon-widget-servicegroup-monitoring-1.1.0.tar.gz

# mv ./centreon-widget-host-monitoring-1.1.2 /usr/local/centreon/www/widgets/host-monitoring
# mv ./centreon-widget-hostgroup-monitoring-1.1.1 /usr/local/centreon/www/widgets/hostgroup-monitoring
# mv ./centreon-widget-service-monitoring-1.1.2 /usr/local/centreon/www/widgets/service-monitoring
# mv ./centreon-widget-servicegroup-monitoring-1.1.0 /usr/local/centreon/www/widgets/servicegroup-monitoring
# chown -R centreon:centreon /usr/local/centreon/www/widgets/
|
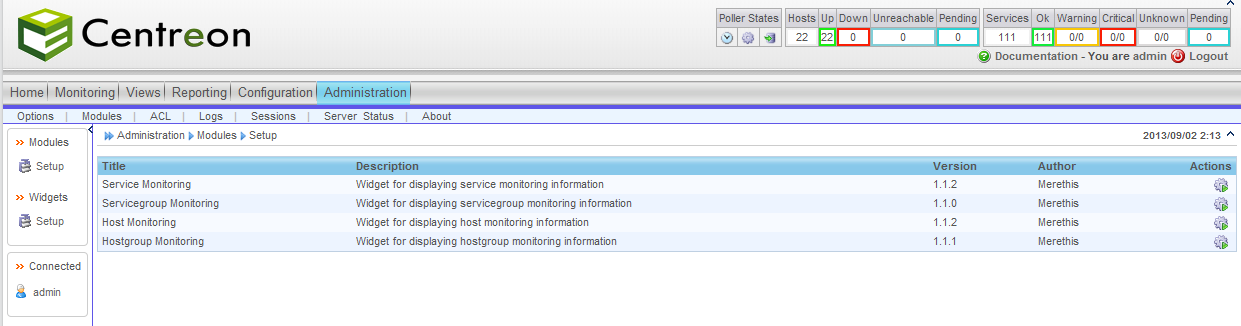
Webからアクセスして、Widgetのインストール画面からインストール。場所は Administration - Modules - Widgets

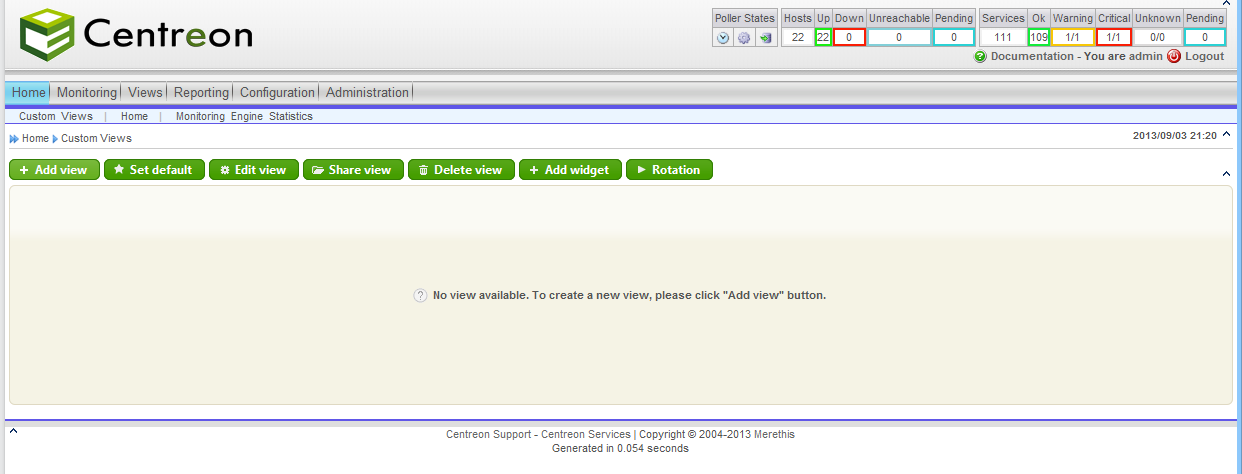
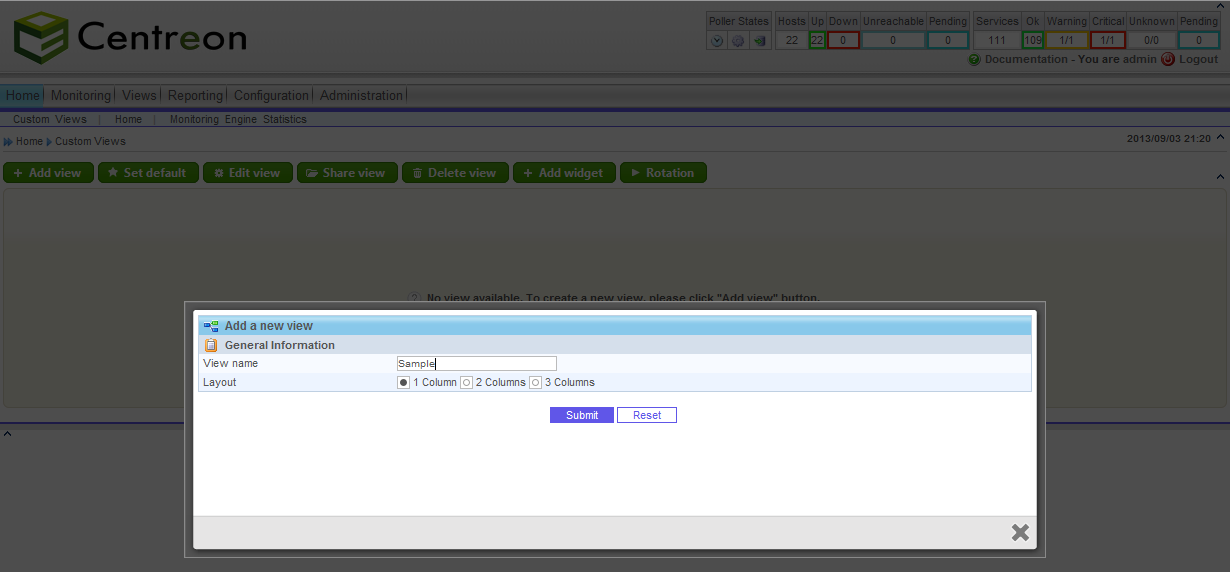
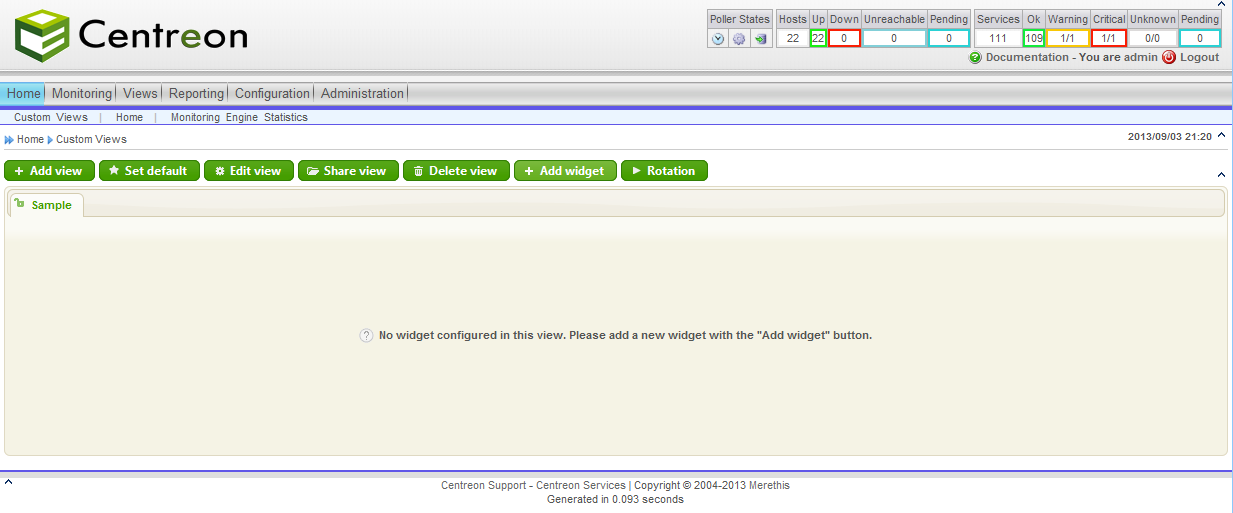
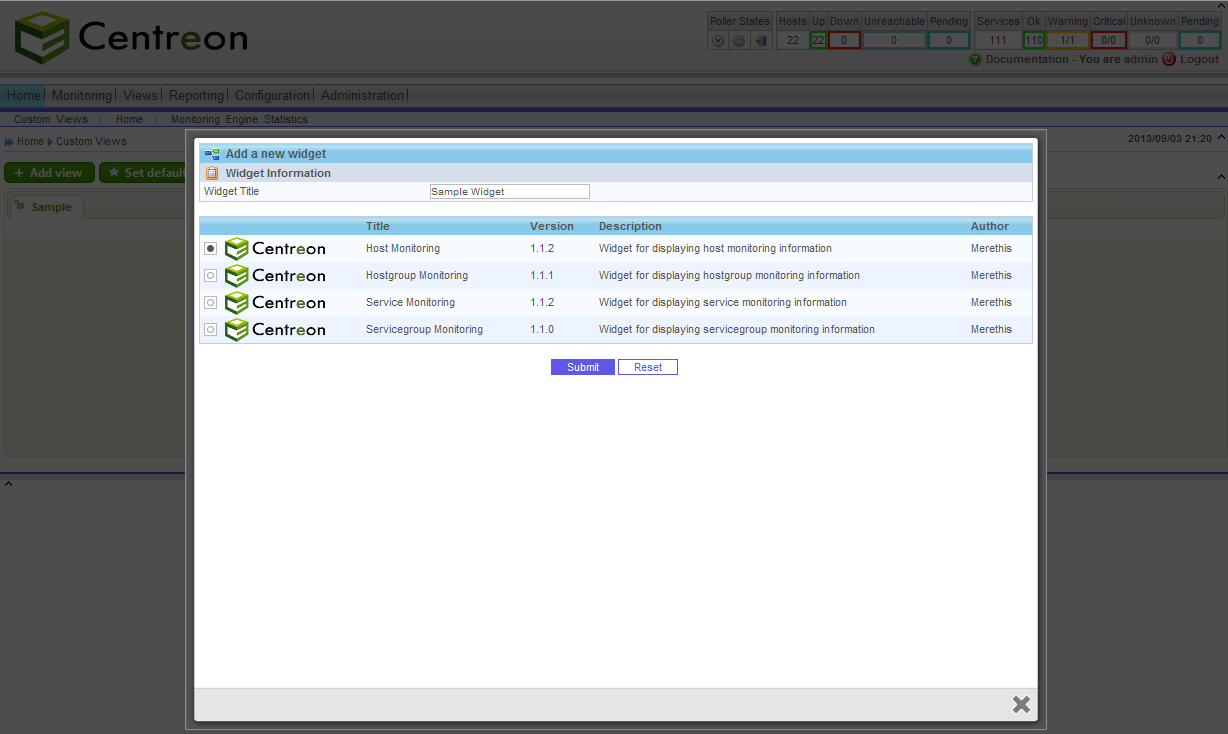
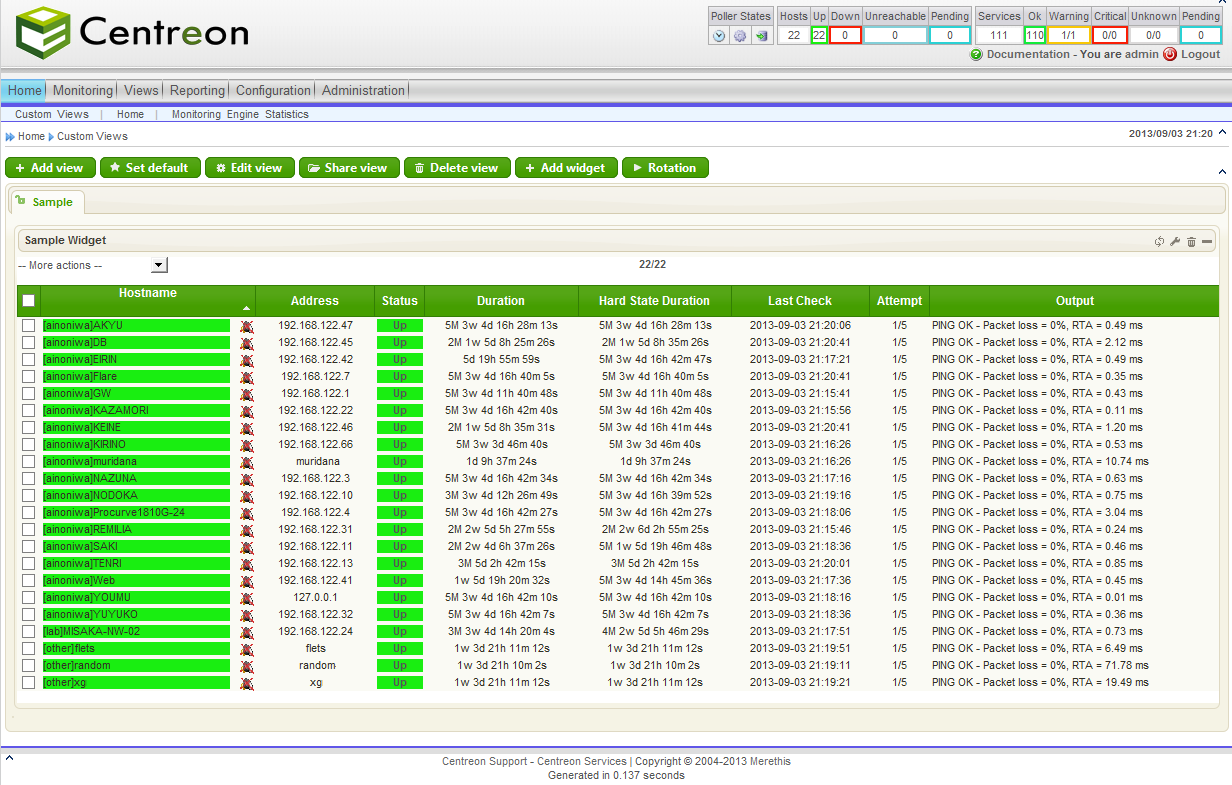
後は設定するだけなので、Add View, Add Widgetの順に設定していく。
当然グラフも描きたいわけだが、どうも前述のURLにはリンクがなく centreon forge から拾ってくることになるようです。
1
2
3
4
|
# wget http://forge.centreon.com/attachments/download/1508/centreon-widgets-1.0.0.tar.gz
# tar zxf centreon-widgets-1.0.0.tar.gz
# ls
centreon-widgets-1.0.0.tar.gz  graph-monitoring  host-monitoring  hostgroup-monitoring  service-monitoring  servicegroup-monitoring
|
そして、この記事書きながら「あれ?全部あるから、Centreon.comから拾ってくる方法要らないんじゃね?」と思いました。
うん、これ全部そのままmvで配置すれば良かったんじゃないかな。
まぁいいです。
で、配置。
1
2
|
# mv ./graph-monitoring /usr/local/centreon/www/widgets/graph-monitoring
# chown -R centreon:centreon /usr/local/centreon/www/widgets/graph-monitoring
|
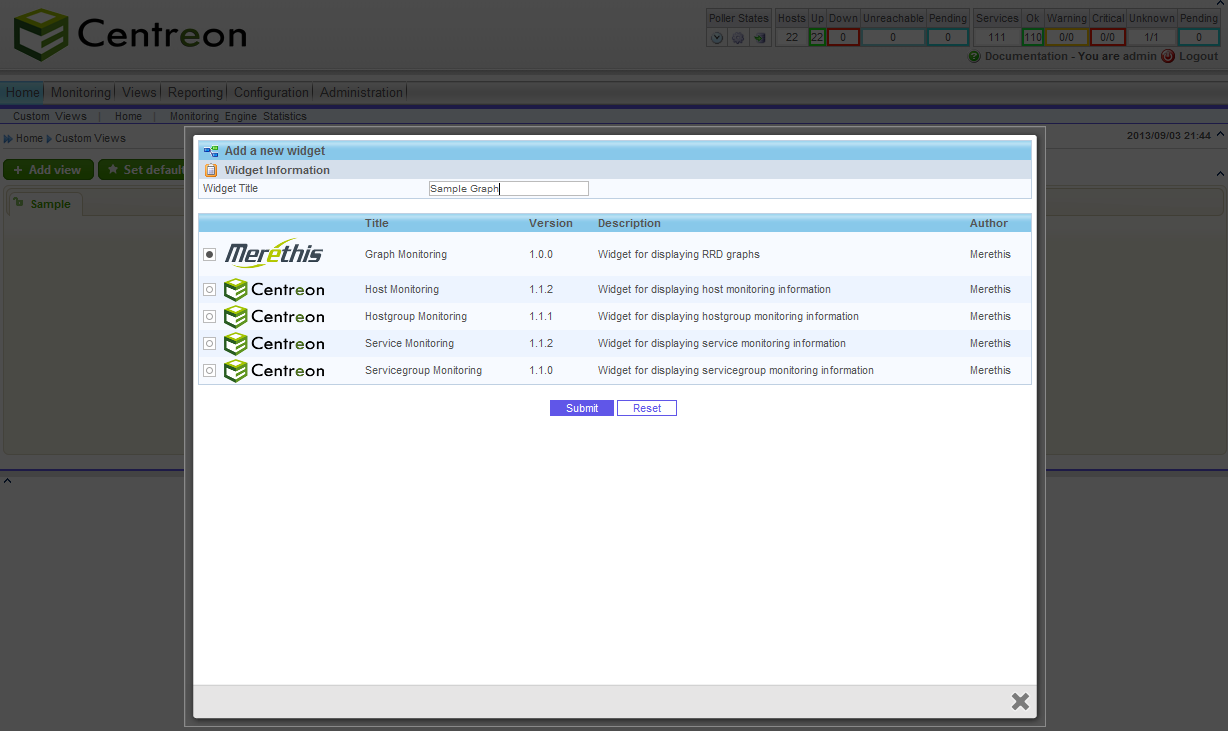
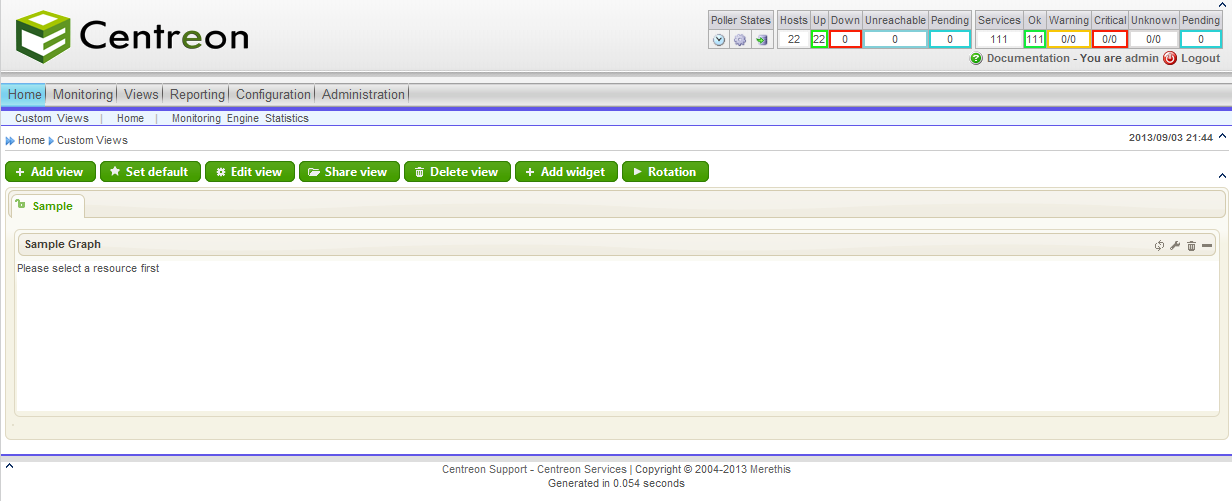
GUI操作はさっきと一緒なので割愛。
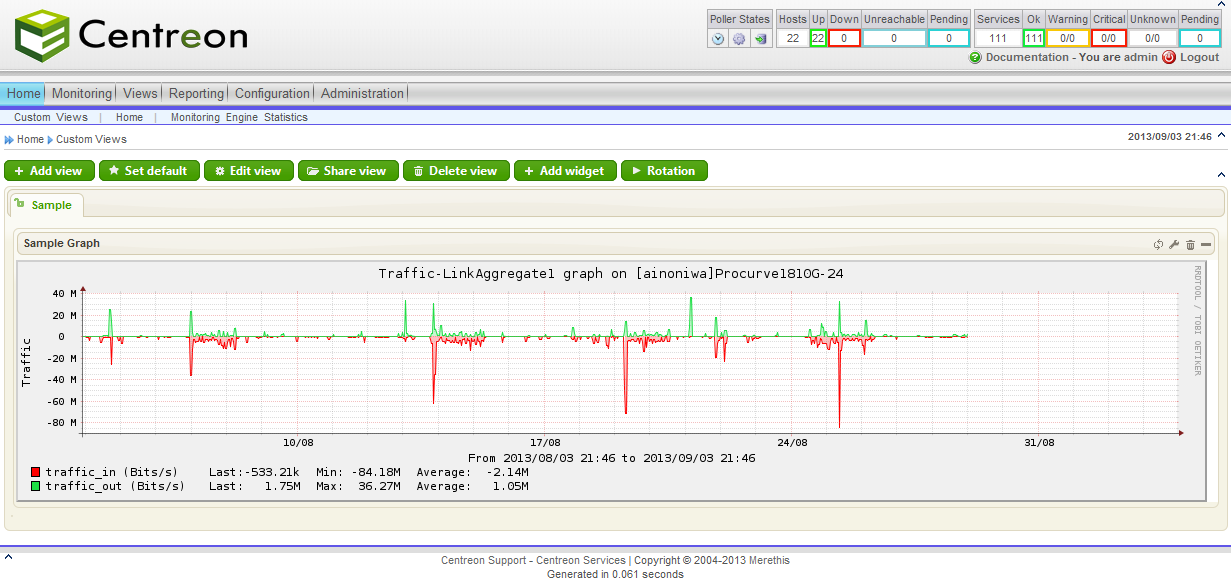
試しに基幹SWのNAS向けLAGの転送レートをグラフにしてみます。
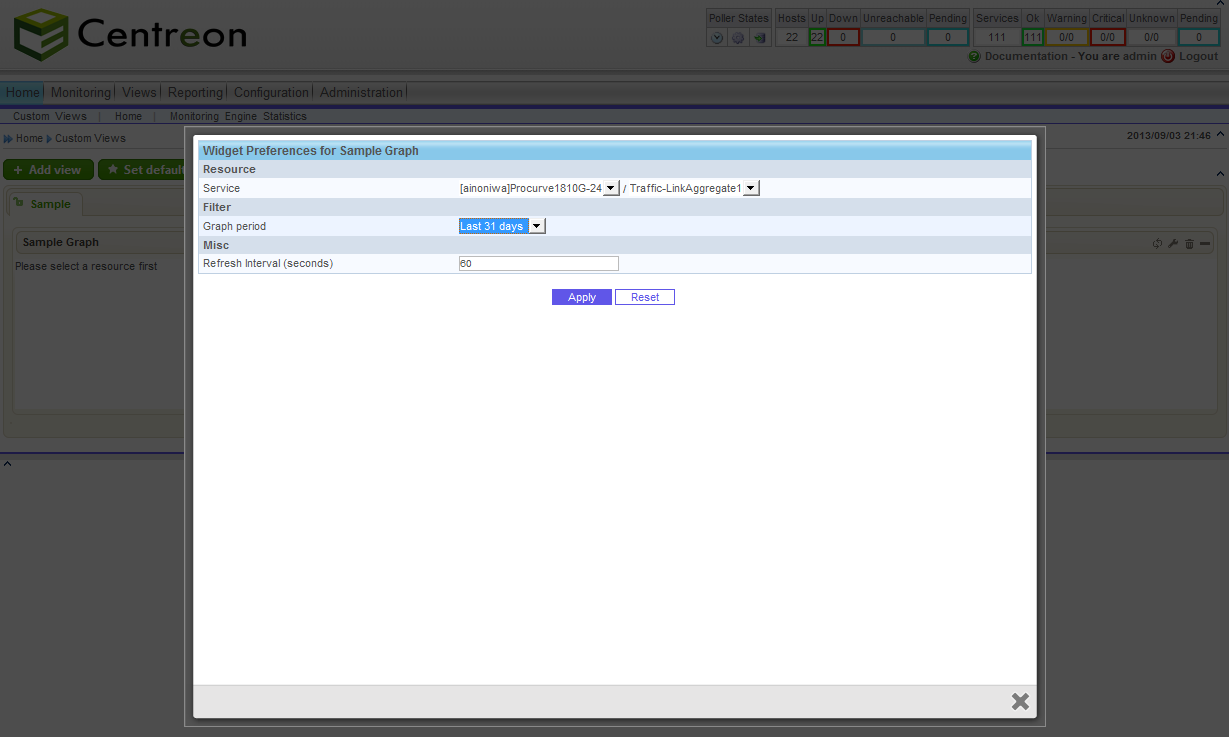
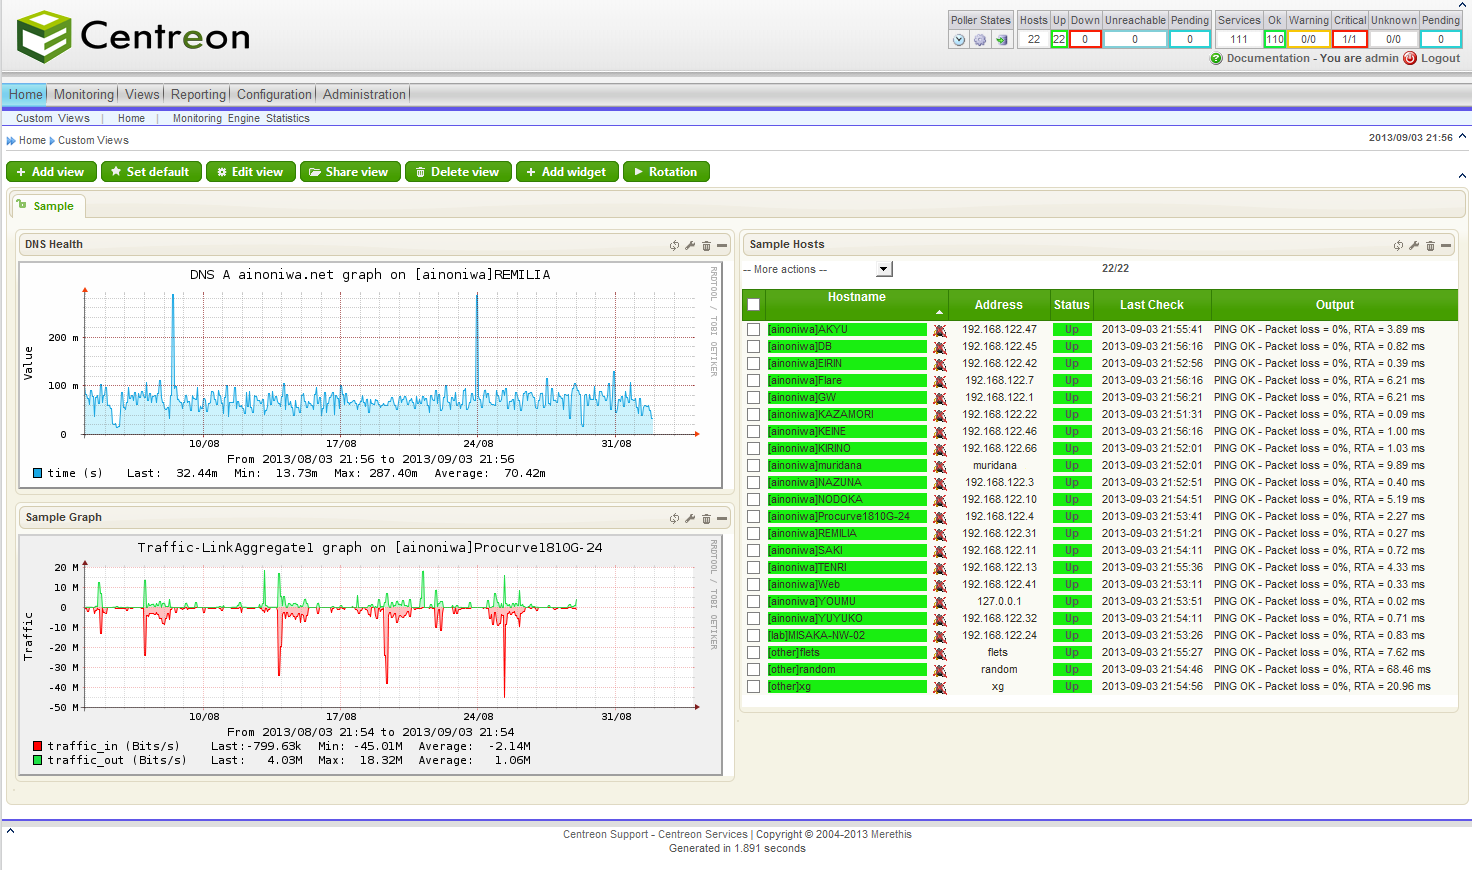
ついでに、適当なDNSの応答時間グラフを描いてみたりして並べたりしてみる。
おしまい
nagiosコアなCentreonもよろしくね!